Performance analytics
Re-design, web, client & internal users
2025

Context
The Performance analytics dashboard is a comprehensive tool for managing and displaying campaign performance data. It aggregates data from different API sources such as Meta API, TikTok One and IQ data.
It serves as the primary interface for tracking campaign performance across multiple platforms (Instagram, TikTok, YouTube, Snapchat) and is designed for internal admins as well as clients.
It also allows users to download data in CSV format for post campaign analysis report prepared from clients.
The Problem
The page wasn’t widely used because the data wasn’t trusted, and the client service team ended up using it only to download information for manual spreadsheet updates. The teams also preferred using spreadsheets due to extensive customisation they allow.
Goal
Increase adoption of the reporting page across internal and external users, enhance trust in the data presented, and position the dashboard as the single source of truth by aggregating all campaign data on the platform.
Before

Uncovered issues
👎 Tabs for platforms
Layout with a separation by platforms didn’t allow users to compare content across different platforms
👎 Grouping by creator
Grouping by creator didn’t allow users to compare individual deliverables by different creators and required too many clicks.
👎 No data source or time stamps
With 4 different API sources, it wasn’t clear for users where the data originated or when it was last updated.
👎 Fixed top metrics
Users could only showcase views, reach and engagements and had no flexibility to customise the metrics according to campaign needs.
👎 Unnecessary info taking space
Thumbnails and captions were taking too much of valuable space and the page required a lot of vertical scroll.
👎 Difficulty finding individual posts
Users had few filtering options and the existing ones weren’t comprehensive and had confusing labelling.
👎 No token connection functionality
Creator token connection is crucial for the data, however the connection flow was located on a different page.
👎 No ability to see what post did the best
Grouping by creator meant that sorting by metric showed only the best-performing creator, not the best-performing post.
Key takeaways
Users would like to….
• Be able to see posts in a single view
• Have more customisations
• Have more visibility of data sources
• See data in the past, not just live data
• Have multiple views to showcase different data sets to clients
Actionable points
• Introduce colours for data sources
• Add timestamps for data sources
• Give ability to view data in the past
• Give ability to create separate views
• Remove grouping by creator and platform tabs
• Make top metrics customisable
• Improve UX for existing filters and action buttons
• Make token connection flow more accessible
• Give users more control over the page and layout
• Give users control of the data export in the CSV
Results
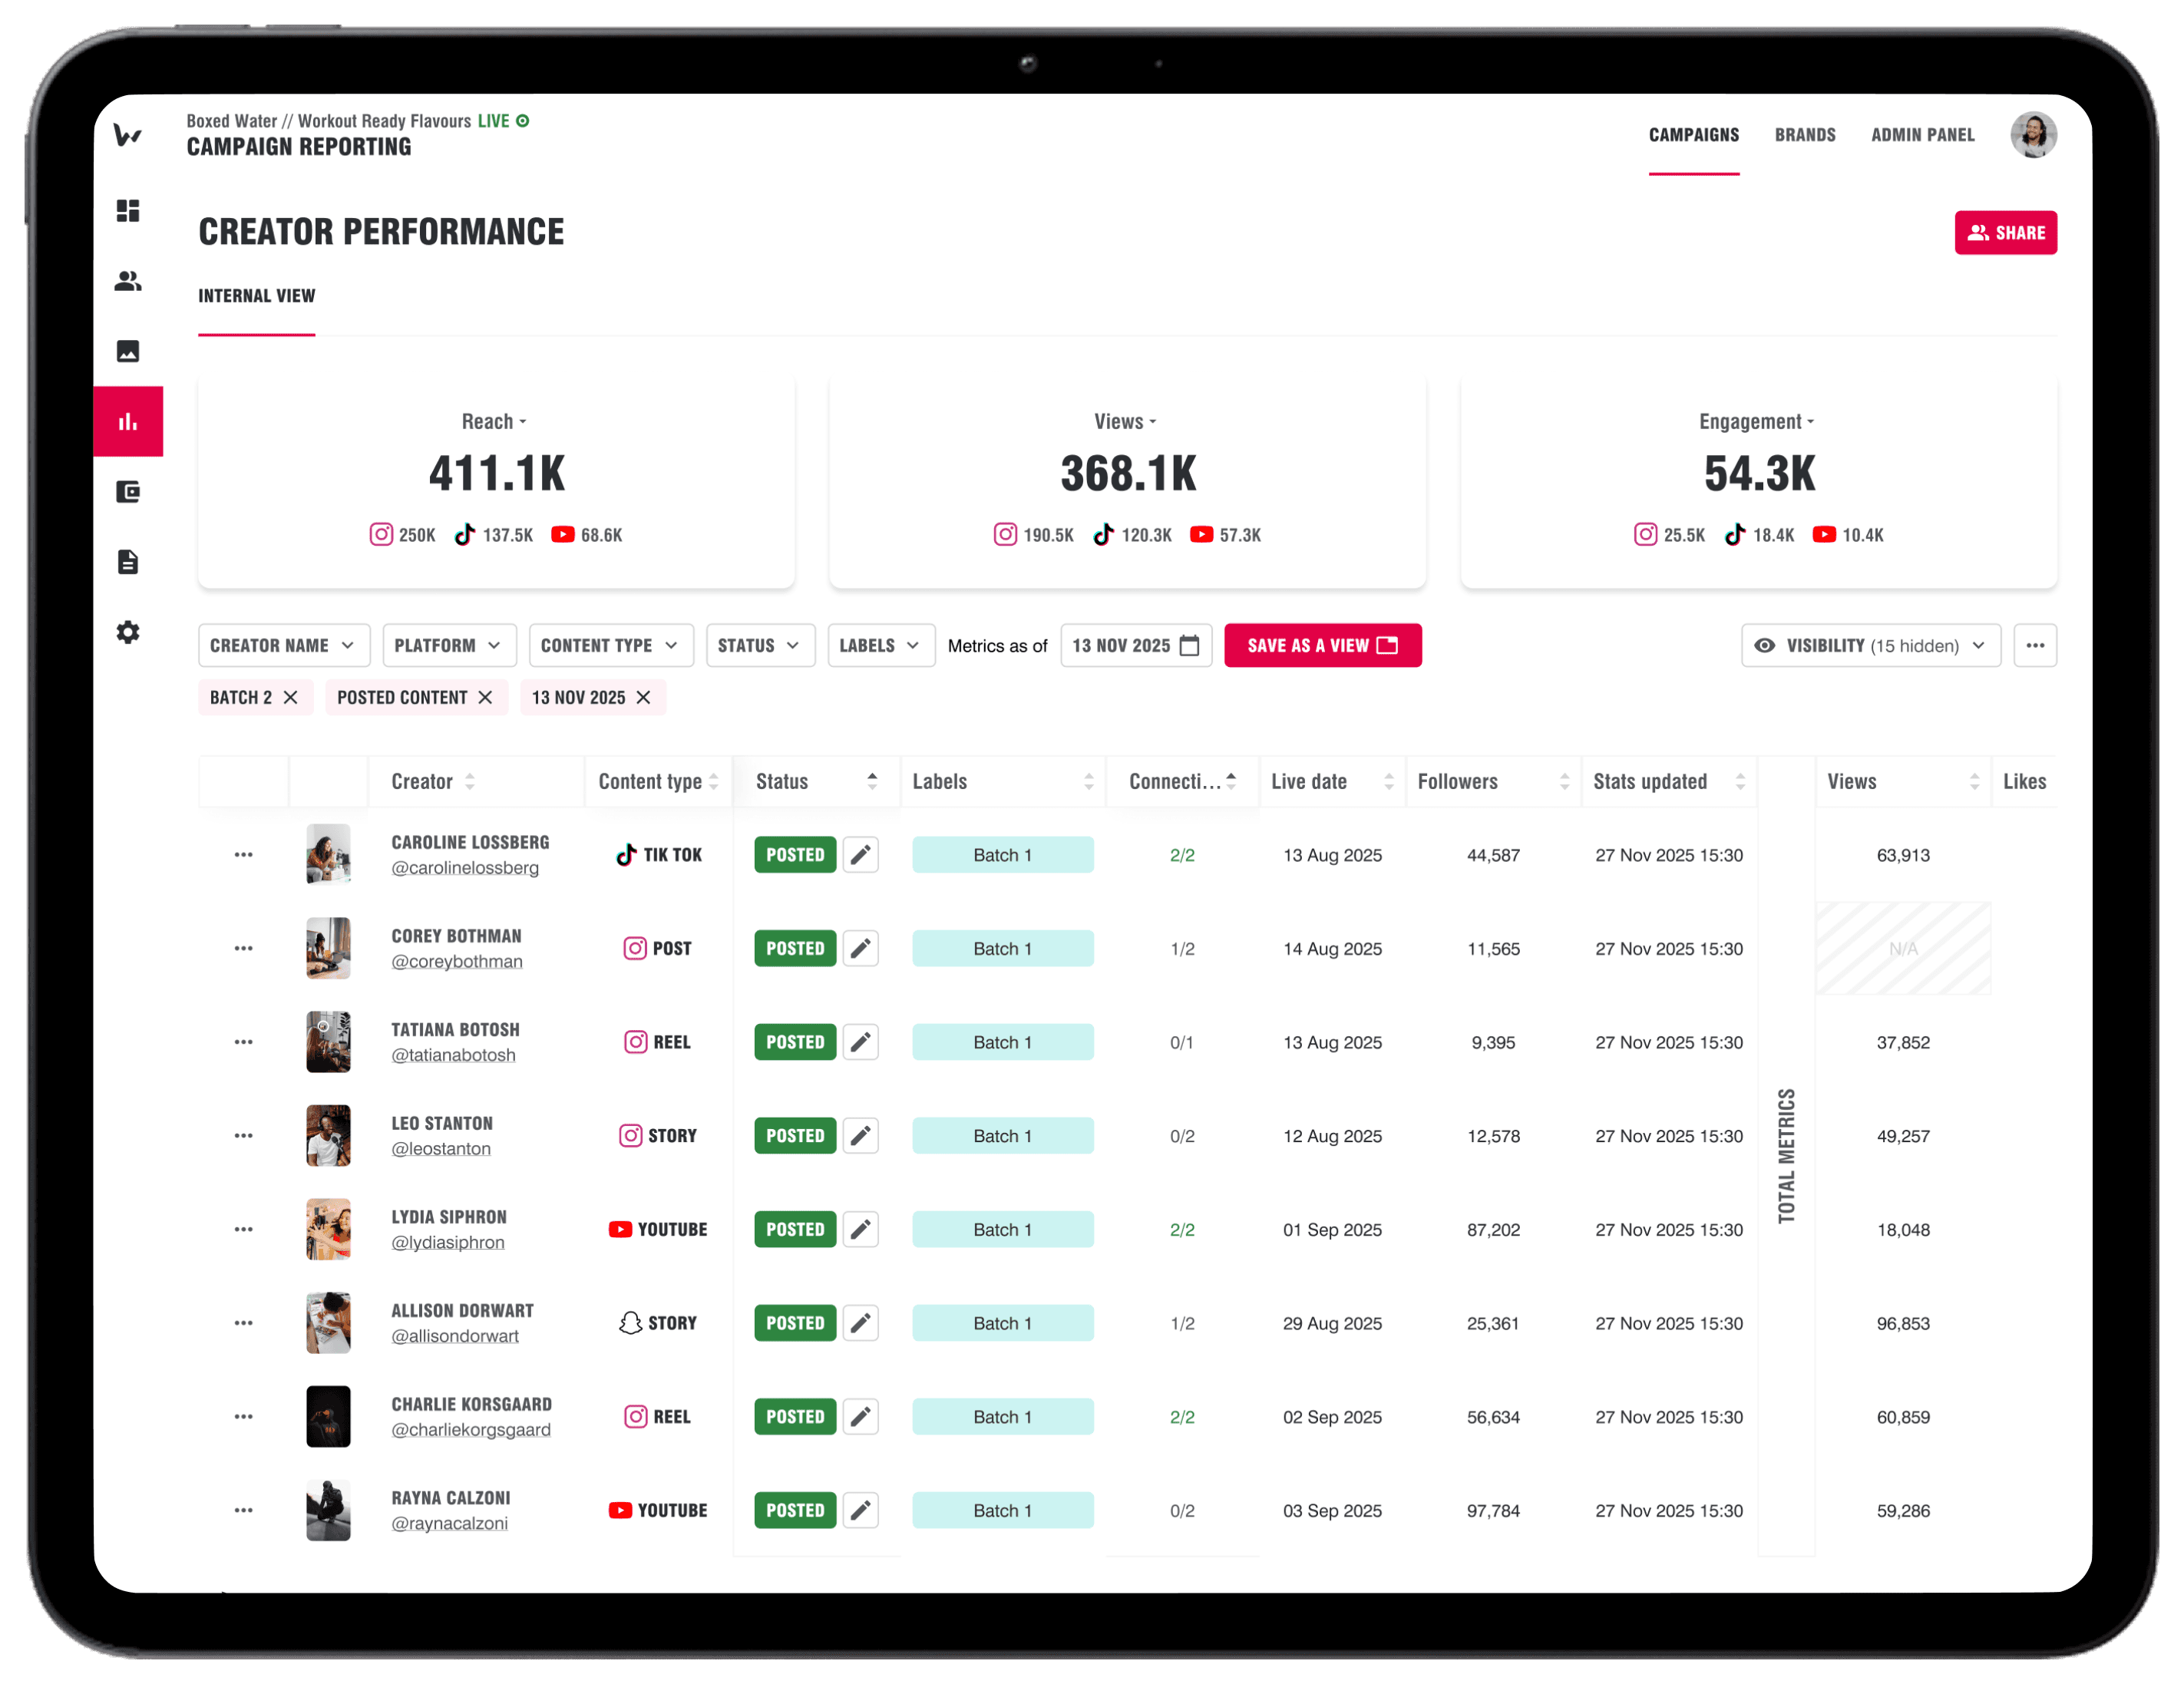
📊 Internal view / default

📊 Internal view / filter
📊 Internal view / metrics calendar
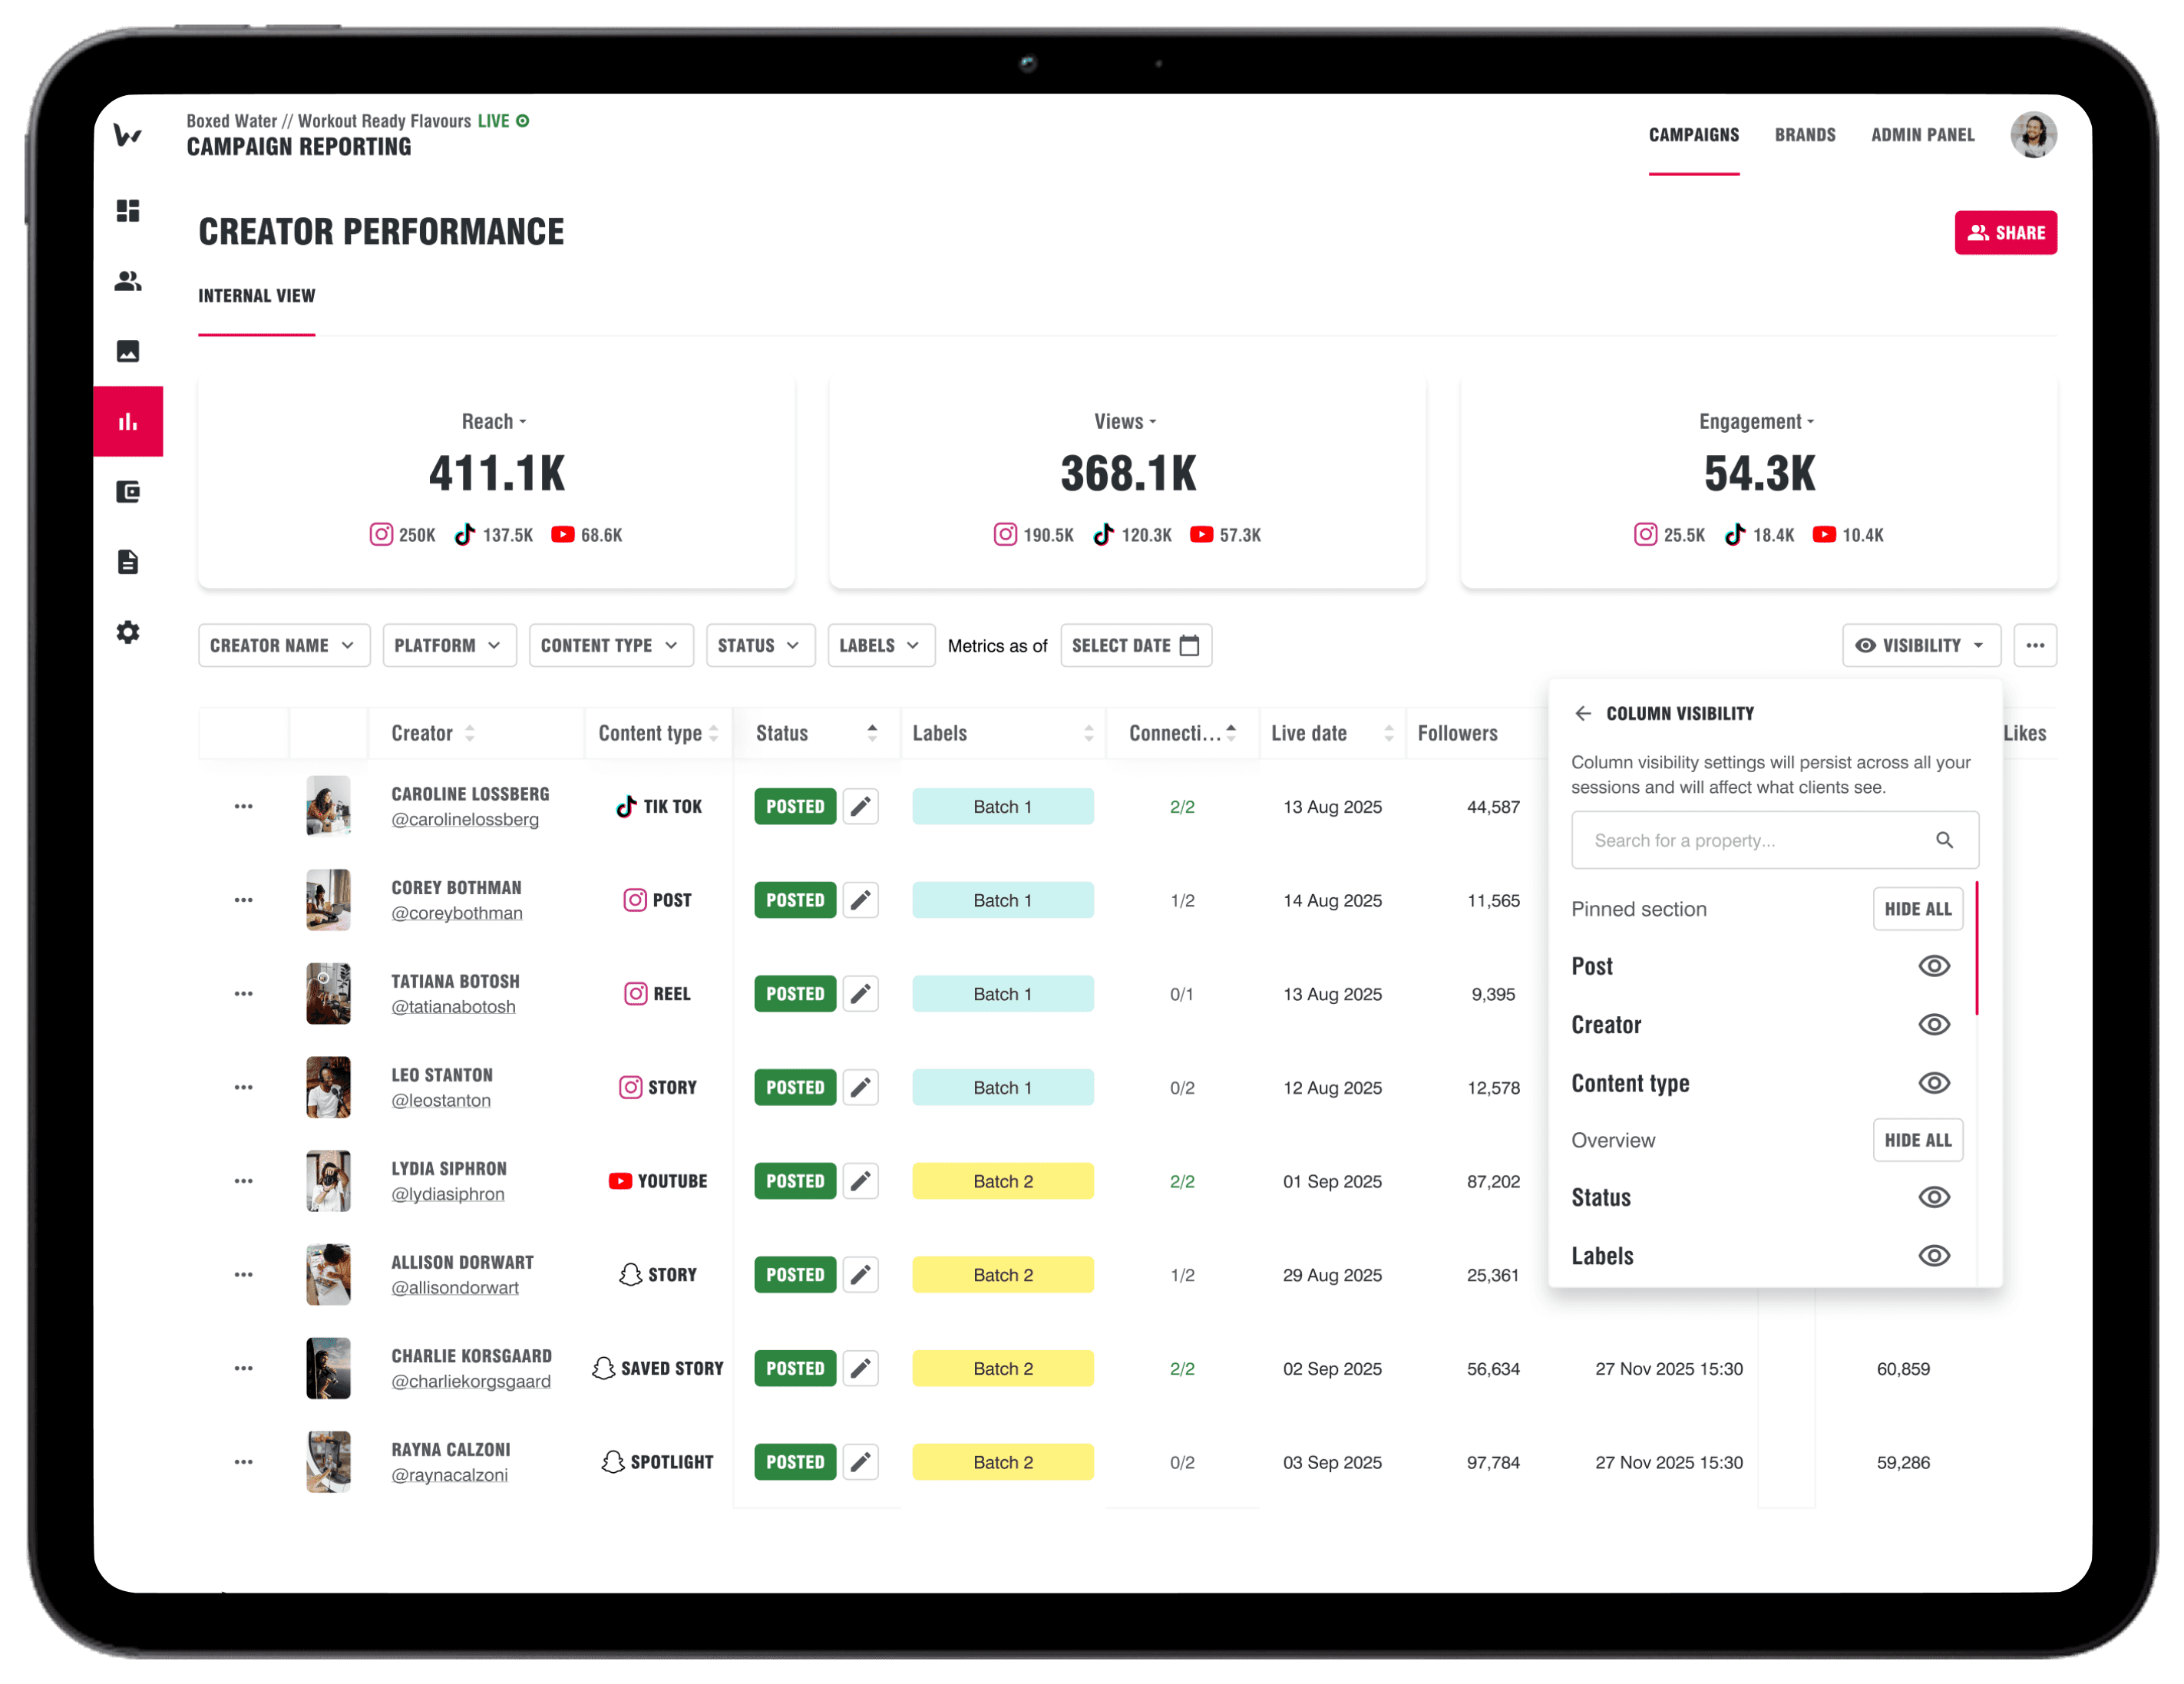
📊 Internal view / visibility settings
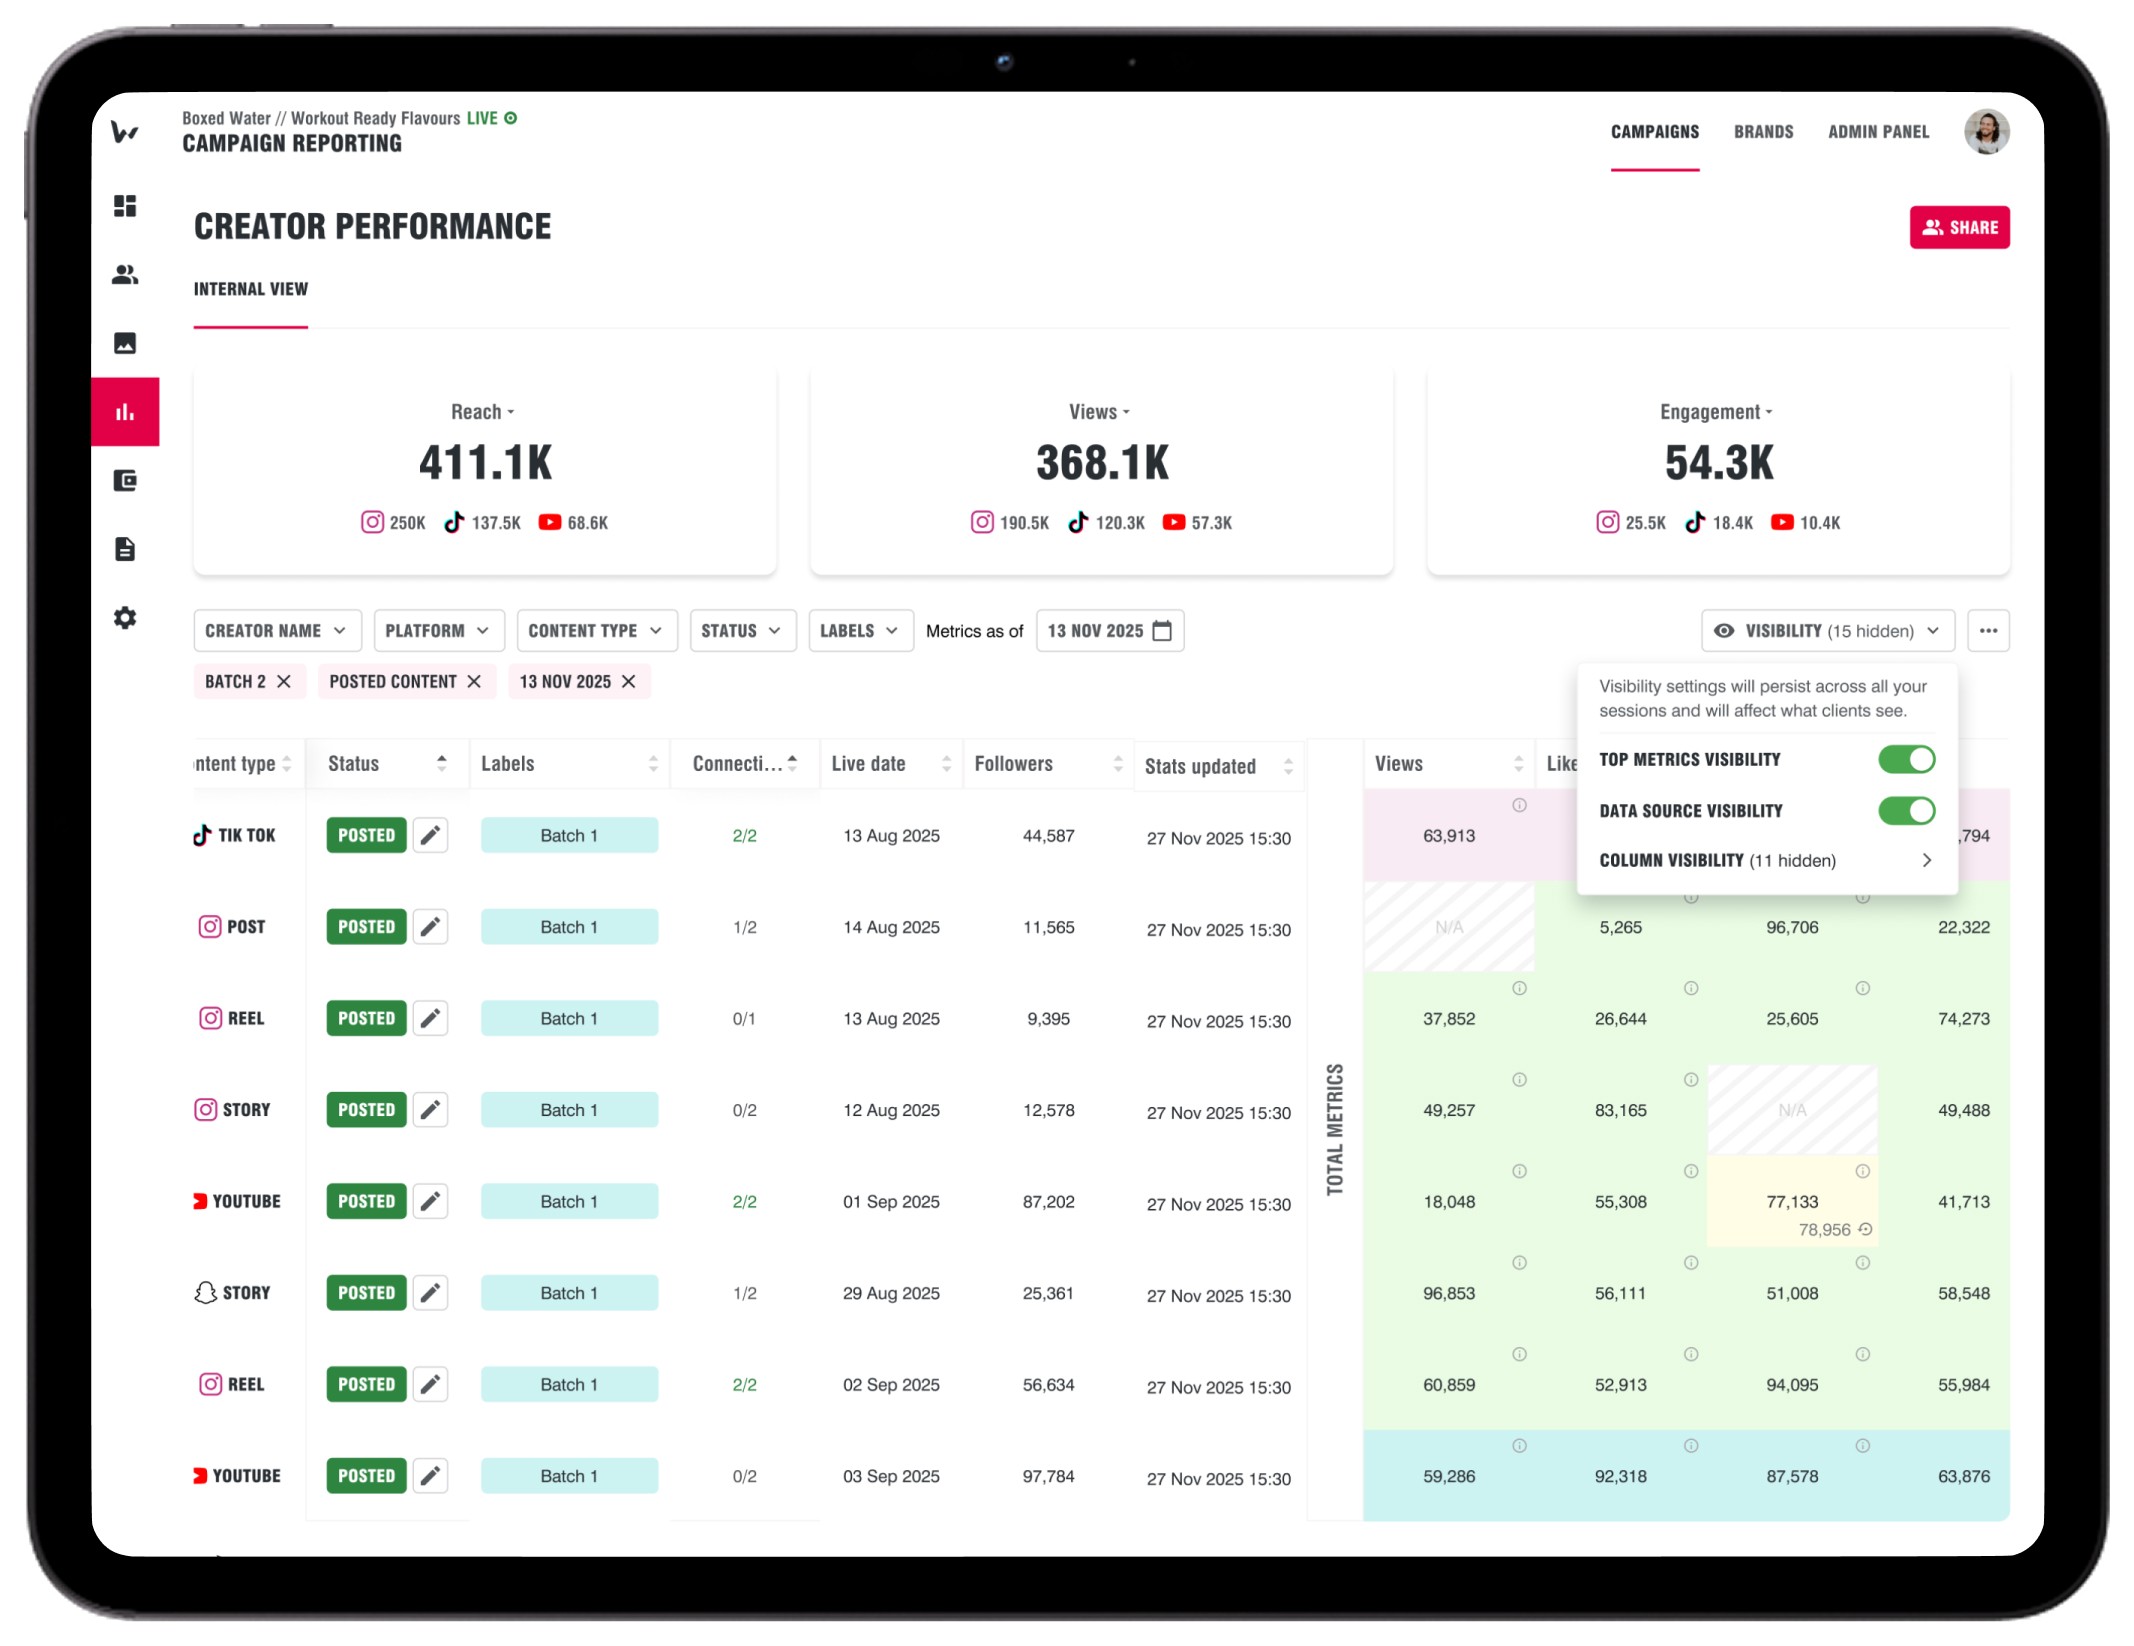
📊 Internal view / data source
📊 Internal view / new view creation
📊 Internal view / client view

Results in detail
👍 All platforms on one page
Layout without tabs allows users to compare content from different social platforms between each other.
👍 All creators on a single page
Getting rid of grouping by creator allowed users to compare content by different creators between each other.
👍 Data source & last updated time stamp
Source colours, the 'last updated' column and info icon help users understand where the data comes from and when it was updated.
👍 More customisations
Users now have the ability to customize total metrics, adjust the visibility of columns, sections, and pages, and create custom columns.
👍 New informational hierarchy
New singe view layout allows users to compare content from different social platforms between each other.
👍 Brand new & updated filters
New filters allow users to see content by a certain creator or posted on a certain social media platform in isolation.
👍 No token connection functionality
Adding token-connection controls gives users a quick way to request tokens and unlock additional reporting data.
👍 Sorting functionality
We introduced columns with sorting functionality for each metric so that users could see which post performed the best
👍 Calendar to view metrics in the past
Added a calendar to view data as of a date in the past instead of just showing accumulative data as of today.
👍 Additional tabs with a subset of data
Introduced a way to create additional tab based on a certain filtering parameter such as data, platform or campaign phase.
Impact